/
Demand Duration
Demand Duration
- Paul Ogle (Unlicensed)
- Mark Fenimore (Unlicensed)
- Tucker Watson (Unlicensed)
Owned by Paul Ogle (Unlicensed)
Last updated: Nov 06, 2019 by Mark Fenimore (Unlicensed)
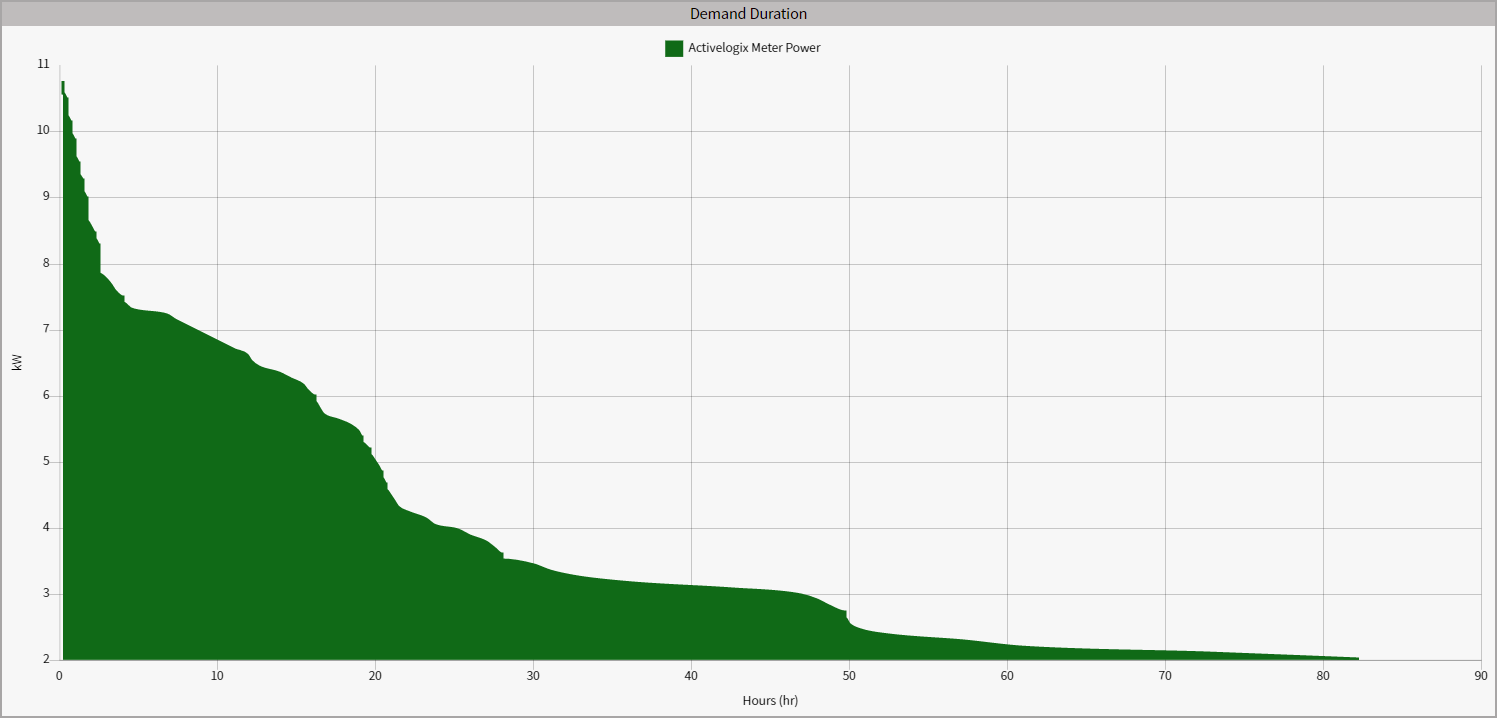
The Demand Duration viewlet enables the display of the amount of time a variable is above a specific level during the selected interval.
Configuration
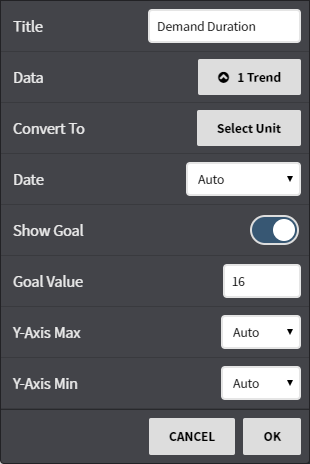
Configuration Options:
- Title: Set a custom viewlet title.
- Data: Select from available trends using either the Picker or Query mode.
- Convert To: Convert the data to comparable units such as kWh to MWh or kWh to BTUs.
- Date: Fine tune when the trend's data is shown. Can be set to auto (global control), a preset date range, or a user selected date range.
- Y-axis Max: Set the Y-axis maximum value
- Y-axis Min: Set the Y-axis minimum value
This feature requires the part number PER-ENERGY
, multiple selections available,
Related content
Energy Profile
Energy Profile
More like this
Multi Chart
Multi Chart
More like this
Ranking Chart
Ranking Chart
More like this