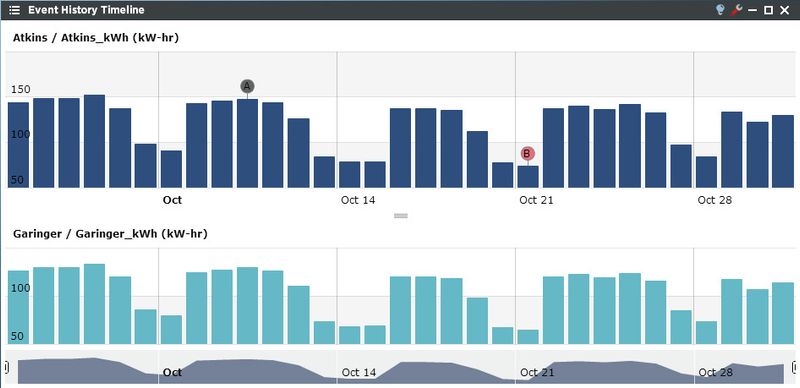
The Event History Timeline provides a powerful stacked chart view for consuming large amounts of information. This viewlet also has capability to drill down into smaller time periods and display user configurable events.
Like other viewlets, configuration is intuitive and straightforward.
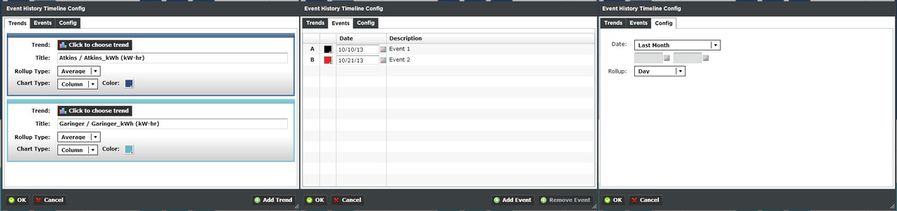
Setting up the Event History Timeline viewlet is a multi-step process.
- Click the wrench icon to display the trend picker. Up to 5 trends may be placed on the viewlet by using the “Add Trend” button at the lower right side of the wizard. The User can customize a number of settings including an optional Trend Title, rollup, and chart type and chart color.
- Use the Events tab to add or remove events by entering the event name and the date of the event. Example: “Lighting Retrofit Completed on 2/23/2011”.
Lastly, use the Config tab to select the date range of interest using one of the pre-defined periods (Year-to-date, Month-to-date, Last Year, etc.) or a custom date range. A variable roll-up period can also be selected if desired.