The Year-Over-Year Viewlet provides a side-by-side comparison of the monthly value of up to two variables, such as energy consumption, over multiple years for one or more selected months. The dual axis setup allows for different variables at different locations to be plotted against one another. This is useful for a quick analysis of year over year trends by the month.
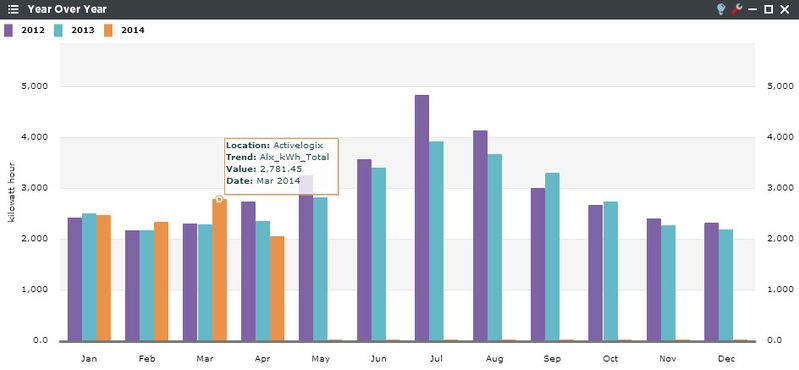
The scale of each axis is different, so be sure to understand the true value for each variable. Rollover pop-ups help identify the trends.
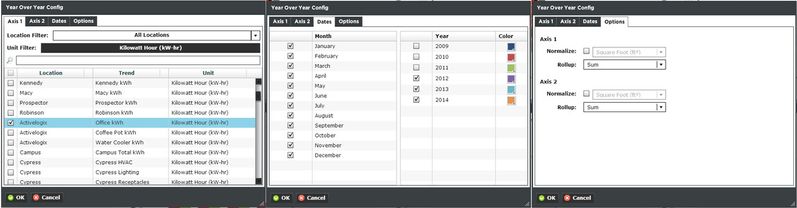
Year-Over-Year Configuration
There are four tabs in the Year-Over-Year Viewlet’s configuration menu. The first two are for filtering the trends by unit and/or location, and selecting which variables which will be on each Y-axis. The user can choose the months and years which will be compared in the “dates” tab, and normalization and rollups are specified in the “options” tab.