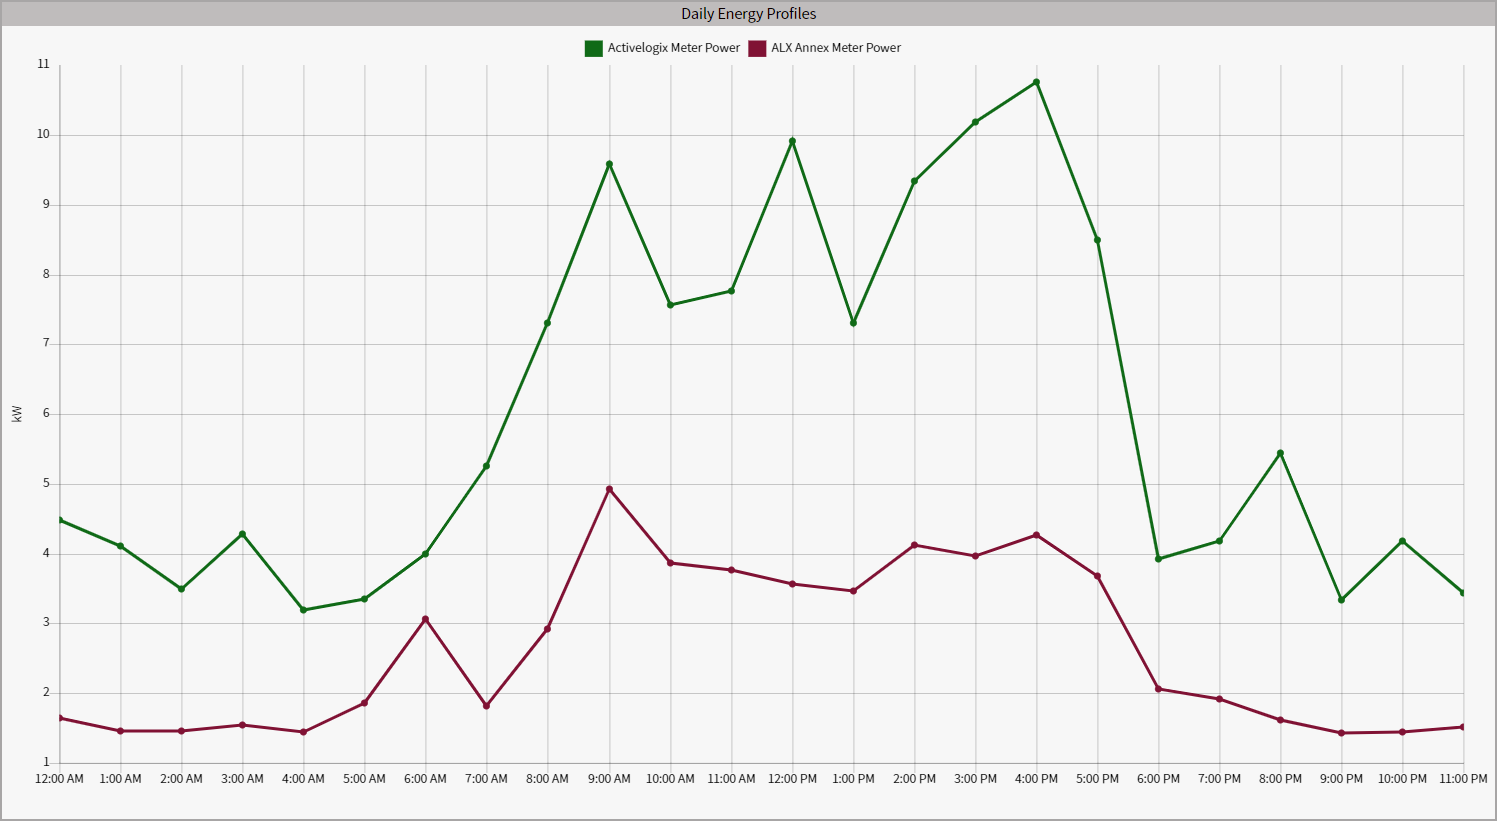
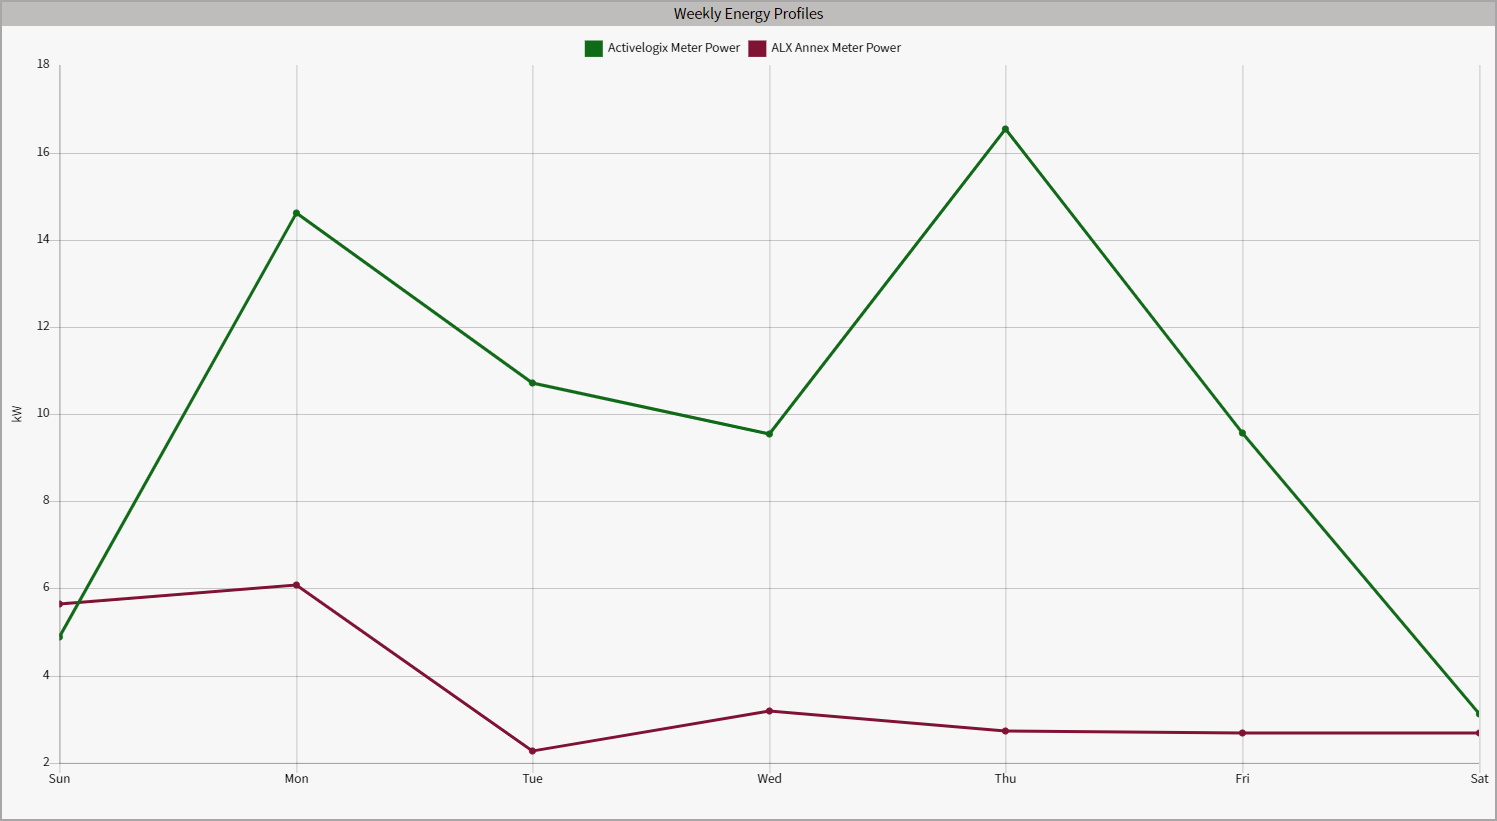
The Energy Profile Viewlet enables users to quickly identify anomalies in data and compare average profiles to different periods of times or different trends. The viewlet can show both a 24-hour profile or weekly profile for any given trend.
Configuration
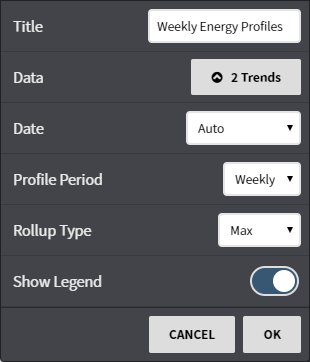
Configuration Options
- Title: Set a custom viewlet title.
- Data: Select from available trends using either the Picker or Query mode.
- Date: Fine tune when the trend's data is shown. Can be set to auto (global control), a preset date range, or a user selected date range.
- Profile Period: Pick from Daily or Weekly energy profiles.
- Rollup Type: Average, sum, min/max, or count the records for the date or date range provided.
- Show Legend: Turn the legend on or off.
This feature requires the part number PER-ENERGY


