The tree map provides a unique visualization into hierarchical structures. It is effective in showing anomalies and patterns across different depths of a hierarchy.
...
Selecting the clock icon will open up the animated timeline which you can play and see the changes as they happened over a set period of time.
...
The timeline settings offer more control over the playback speed and timeline range:
Configuration
Selecting the wrench icon will bring up the tree map configuration window.
Configuration Options:
...
Configuration
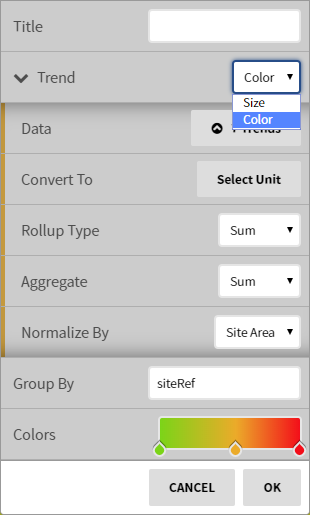
Configuration Options
- Title: Set a title for the View
- Trend: Pick the 'Size' and 'Color' trends Size / Color. Both Size and Color data must be selected in order to generate a visual. Pick rollup types and conversions to similar units. When you normalize the trend by site area, the block's size or color will reflect the changes.Tree Map.
- Data - The trend data for the size or color trend
- Convert To - The unit conversion for the size or color trends
- Rollup Type - The rollup type for the size or color trends
- Aggregate - How the interval records are totalized
- Normalize By - Normalization by sqft option for the size or color trends
- Height: Select the vertical fill of the group of blocks on the screen.
- Date: Either pick 'Auto' to run off the global time frame (calendar), Pick a common 'Date Range', or a custom time range with 'Manual'.
| Info |
|---|
This feature requires the part number PER-ANALYTIC |


